Rethinking Time Series: Vision is All You Need!
Published:
TL;DR
This article mainly shares the important trends we have observed in the field of time series, introduces a related research work by our team, and explains its significance for time series analysis. We found that converting time series into charts may be more suitable for application in large models compared to traditional text representations.
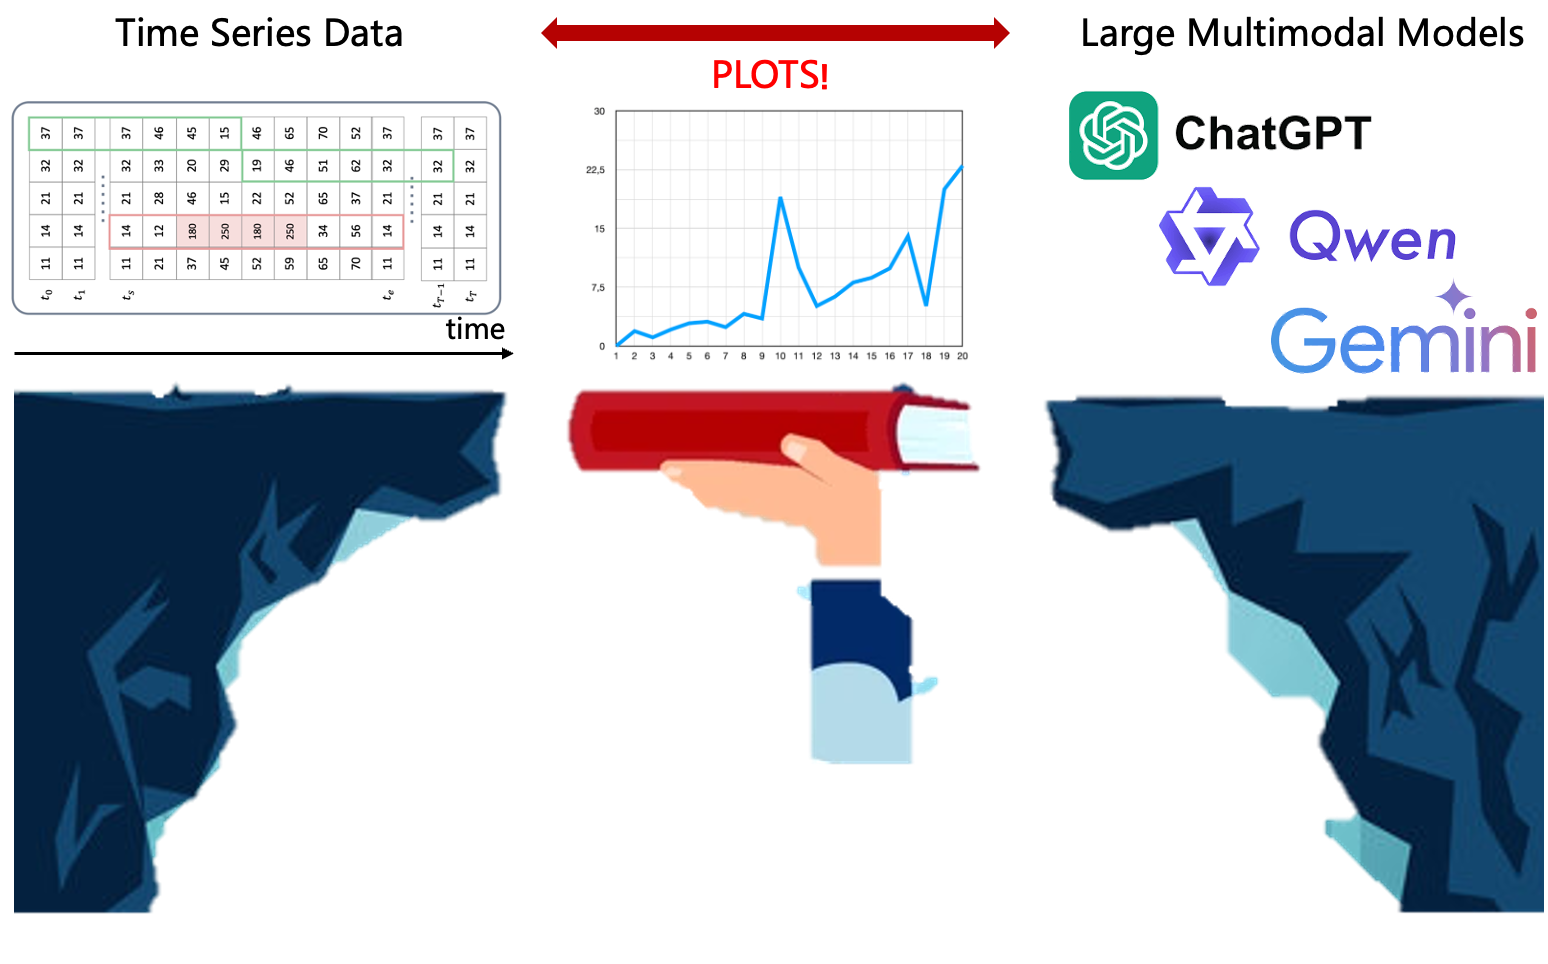
Visual Representation of Time Series
More and more research is beginning to transform time series data into visual modalities to fully leverage the visual understanding and reasoning capabilities of large multimodal models (LMM). For example, the TAMA framework converts time series data into images and combines models like GPT-4 and Gemini-1.5-pro for anomaly detection, achieving high accuracy while reducing dependency on sample size. Additionally, TAMA introduces multi-scale self-reflection modules and multimodal reference learning modules to ensure model stability and accuracy under few-shot conditions.
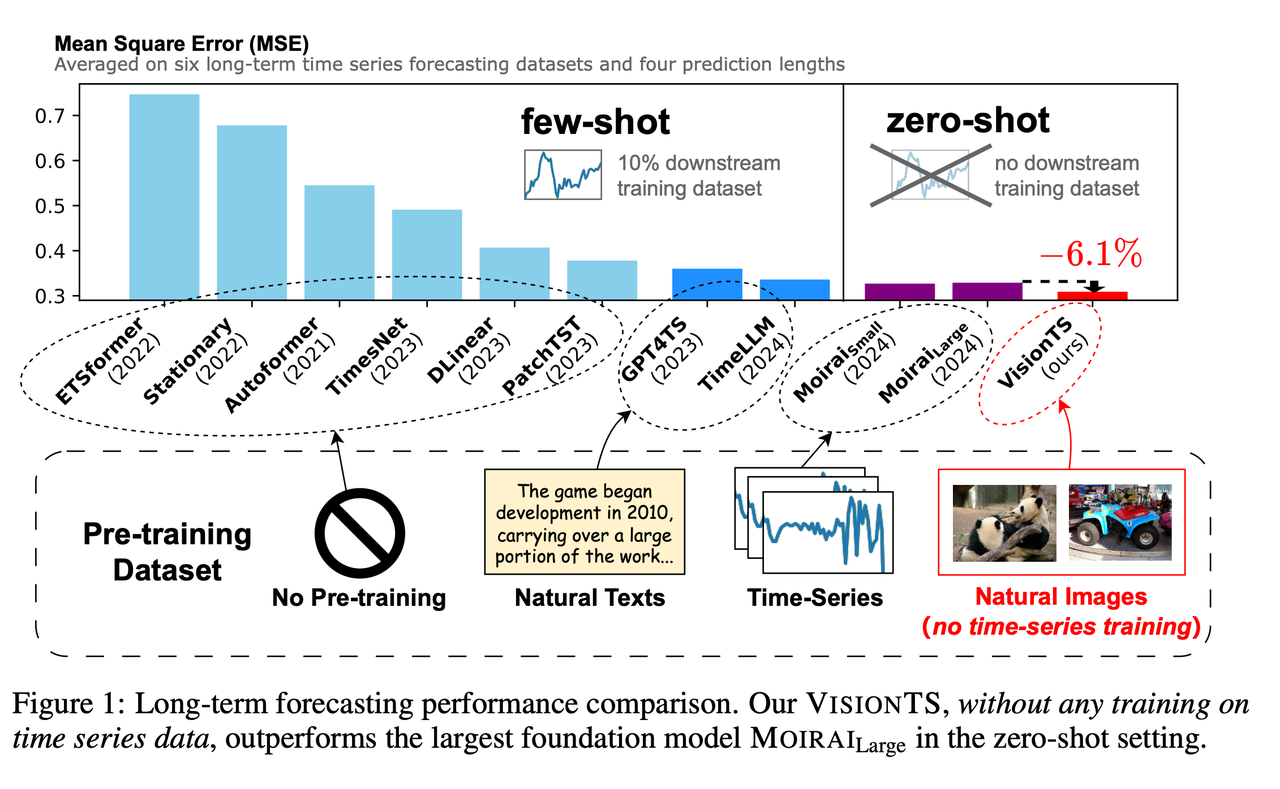
Other studies have also validated the effectiveness of visual transformation methods. For instance, VisionTS uses visual masked autoencoders to convert time series into visual matrices for zero-shot time series forecasting, demonstrating cross-modal transfer potential. Another study
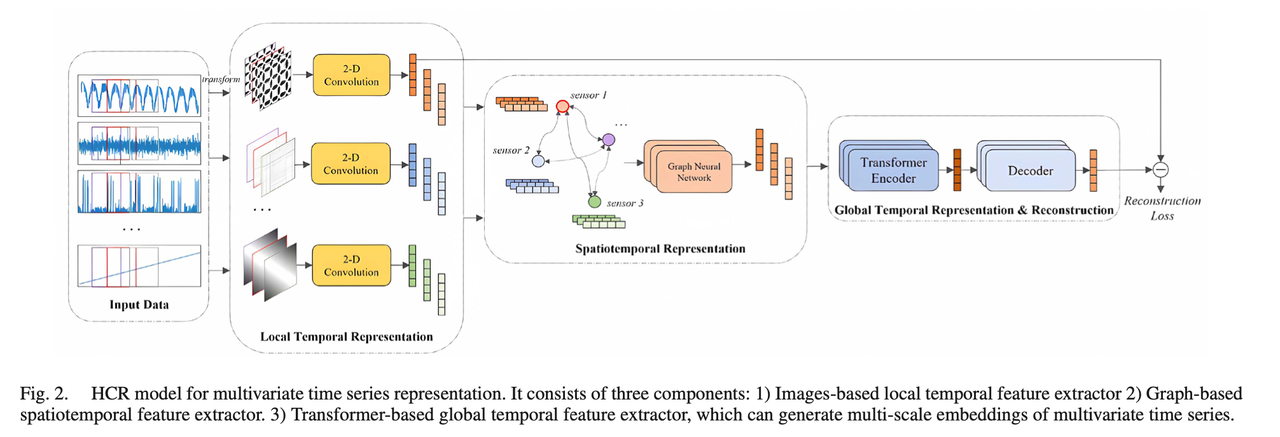
Other studies have also validated the effectiveness of visual transformation methods. For instance, VisionTS uses visual masked autoencoders to convert time series into visual matrices for zero-shot time series forecasting, demonstrating cross-modal transfer potential. Another study shows that converting to visual charts can significantly enhance LMM’s understanding and API cost efficiency, especially in complex reasoning tasks, with performance improvements of 120%-150%. The HCR-AdaAD framework captures spatial and temporal features by converting time series into images, improving multivariate anomaly detection accuracy with adaptive thresholds.
Overall, transforming time series into visual modalities not only leverages the visual processing advantages of large models but also enhances the performance of time series tasks in zero-shot and few-shot environments. This trend indicates that future research in time series analysis will focus on optimizing visual representations to better support large models and designing temporal expressions suitable for visual features. Further exploration of how to construct and optimize these visual features will drive the deep integration of time series analysis with large multimodal models.
TAMA: Leveraging Multimodal Large Models for Time Series Anomaly Detection
For the task of time series anomaly detection, our team proposed the TAMA (Time series Anomaly Multimodal Analyzer) framework. By converting time series data into visual modalities and leveraging the powerful reasoning capabilities of multimodal large models (LMM), we achieved efficient time series anomaly detection. The TAMA framework supports the invocation of various multimodal large models (such as GPT-4o, Gemini-1.5-pro, Qwen-vl-max, etc.) and provides accompanying modality conversion tools for the rapid deployment of multimodal large models in time series anomaly detection tasks.
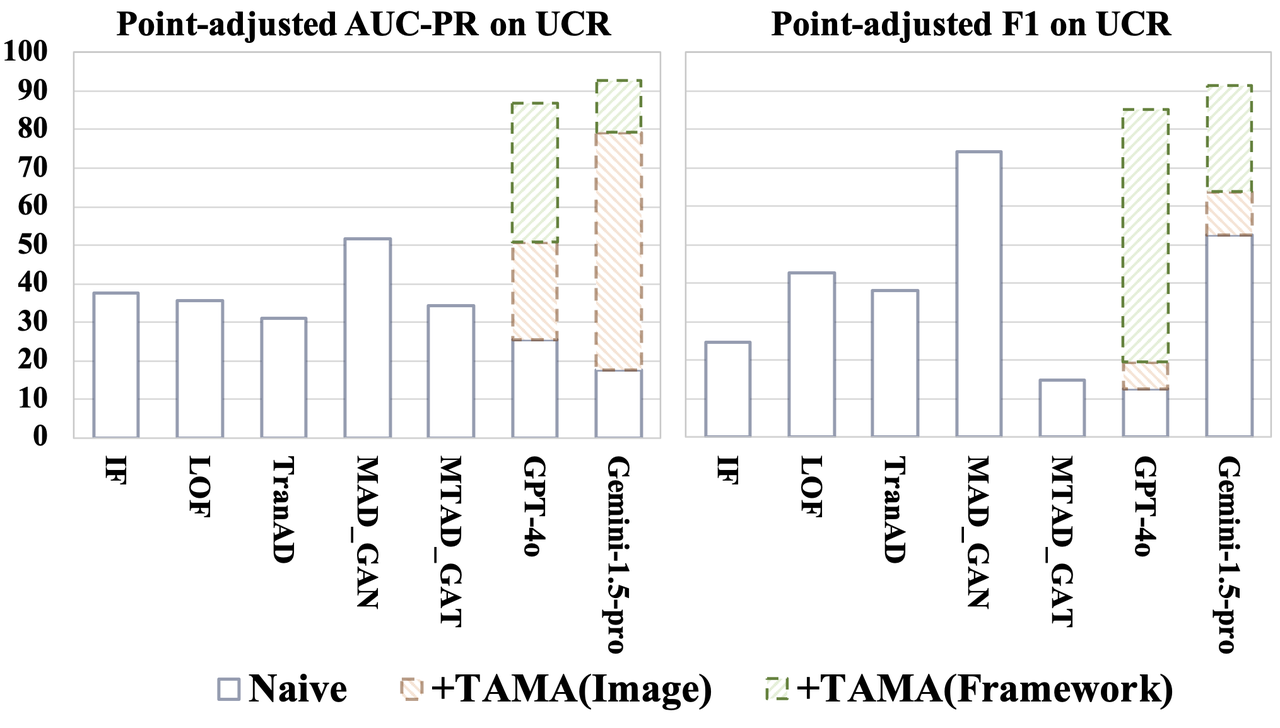
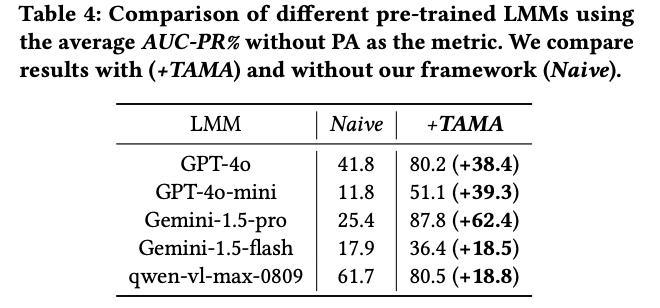
To fully utilize the few-shot capabilities of LMM, TAMA includes a Multimodal Reference Learning module, enabling LMM to quickly learn the characteristics of normal samples, thereby improving the accuracy of subsequent anomaly detection. Additionally, to ensure model stability, we introduced a Multi-scaled Self-reflection module, which helps the model reduce misjudgments through multi-scale time series images.
Comparative experimental results show that TAMA can achieve excellent performance with only a small number of samples. On datasets from different domains, TAMA outperformed most existing machine learning, deep learning, and LLM-based methods, with performance improvements of up to 20%.
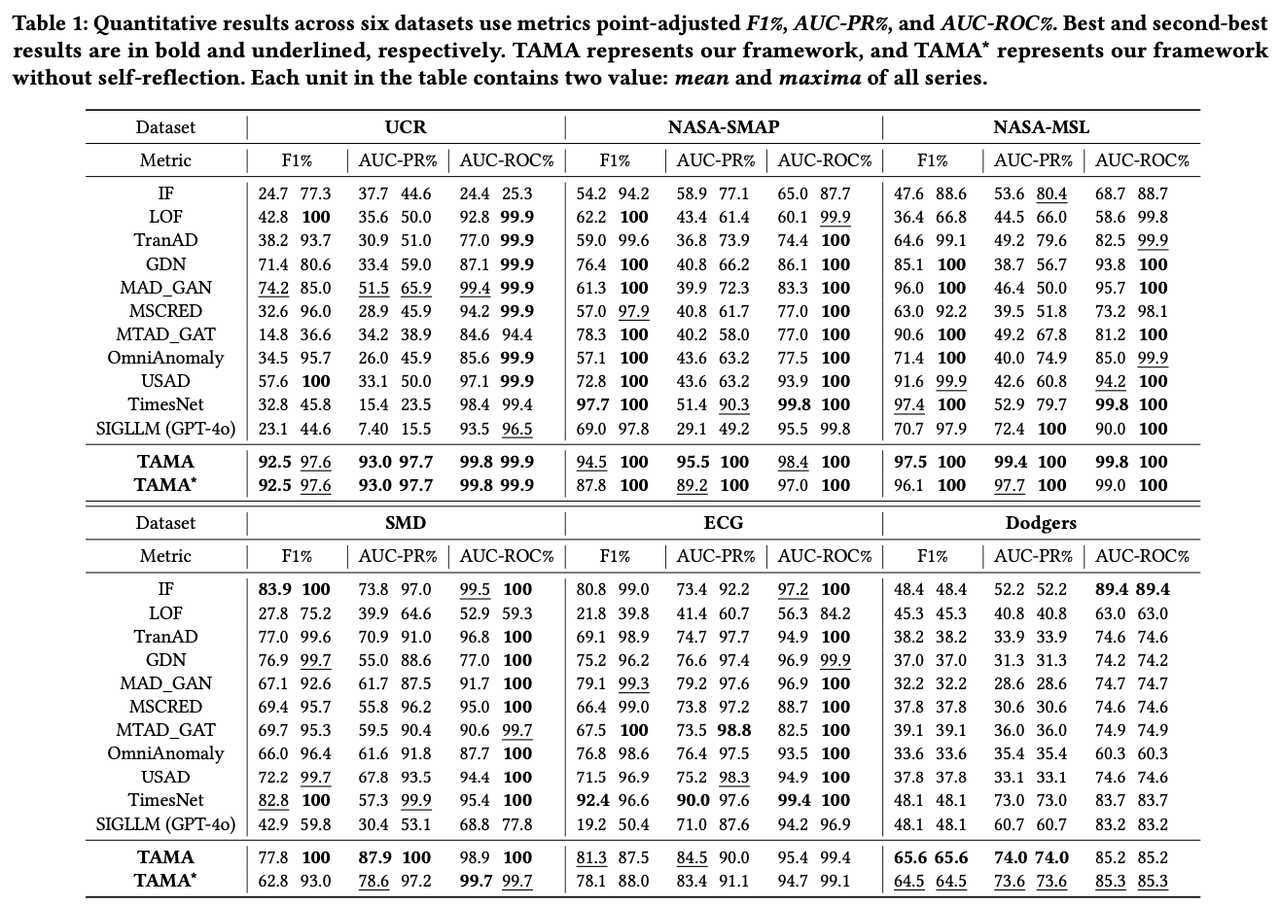
Furthermore, we explored how large models understand the visual modalities of time series. We conducted experiments on additional information in images (such as image orientation, auxiliary lines, scales, etc.). TAMA-R represents images rotated by 90 degrees, and TAMA-A represents inputs without auxiliary lines. Experimental results indicate that image rotation and the removal of auxiliary lines can affect LMM’s judgment of time series to some extent, suggesting that large models are sensitive to images. This may be because image rotation changes the directional characteristics of the time series, making it difficult for the model to understand the original time patterns, while the removal of auxiliary lines reduces the reference information in the image, thereby decreasing the model’s accurate judgment of the data structure. Therefore, we believe that constructing the most suitable visual representations for large model understanding is also a direction worth further research.

Related Concurrent Research
After completing our work, we discovered several concurrent studies that reached similar conclusions. Here are introductions to three such papers:
“Plots Unlock Time-Series Understanding in Multimodal Models”
- Daswani, Mayank, et al. “Plots Unlock Time-Series Understanding in Multimodal Models.” arXiv preprint arXiv:2410.02637 (2024). Link
- This paper from the Google team proposes a method to convert time series data into visual images, enabling multimodal models (such as GPT-4, Gemini, etc.) to better understand time series information. The study shows that compared to inputting time series data in text form, using charts significantly enhances the model’s understanding, especially in zero-shot and complex multi-step reasoning tasks, with performance improvements of up to 120%-150%. Additionally, this method can reduce API costs, as charts can more concisely express large amounts of data, thereby reducing the input cost for models.
“Hierarchical Context Representation and Self-Adaptive Thresholding for Multivariate Anomaly Detection”
- Lin, Chunming, et al. “Hierarchical Context Representation and Self-Adaptive Thresholding for Multivariate Anomaly Detection.” IEEE Transactions on Knowledge and Data Engineering (2024). Link
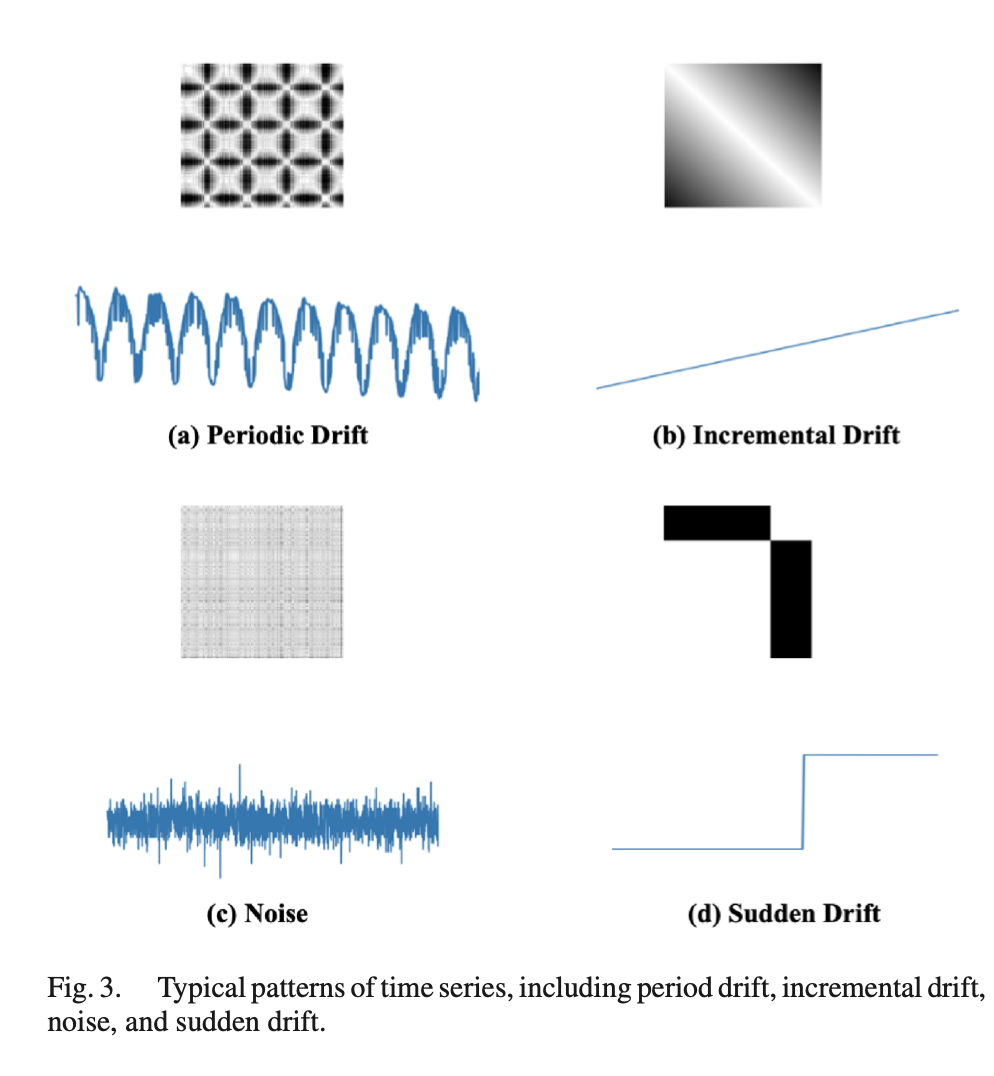
- This paper proposes an anomaly detection framework named HCR-AdaAD, which converts multivariate time series data into two-dimensional images to capture richer spatial and temporal features. The authors first convert time series segments into images to generate local temporal features, then use graph structures to extract spatial correlations, and finally use Transformers to extract global temporal information. This image-based conversion method significantly enhances the model’s ability to identify anomalies and, combined with an adaptive thresholding method, improves detection accuracy without relying on fixed thresholds.
“VisionTS: Visual Masked Autoencoders Are Free-Lunch Zero-Shot Time Series Forecasters”
- Chen, Mouxiang, et al. “VisionTS: Visual Masked Autoencoders Are Free-Lunch Zero-Shot Time Series Forecasters.” arXiv preprint arXiv:2408.17253 (2024). Link
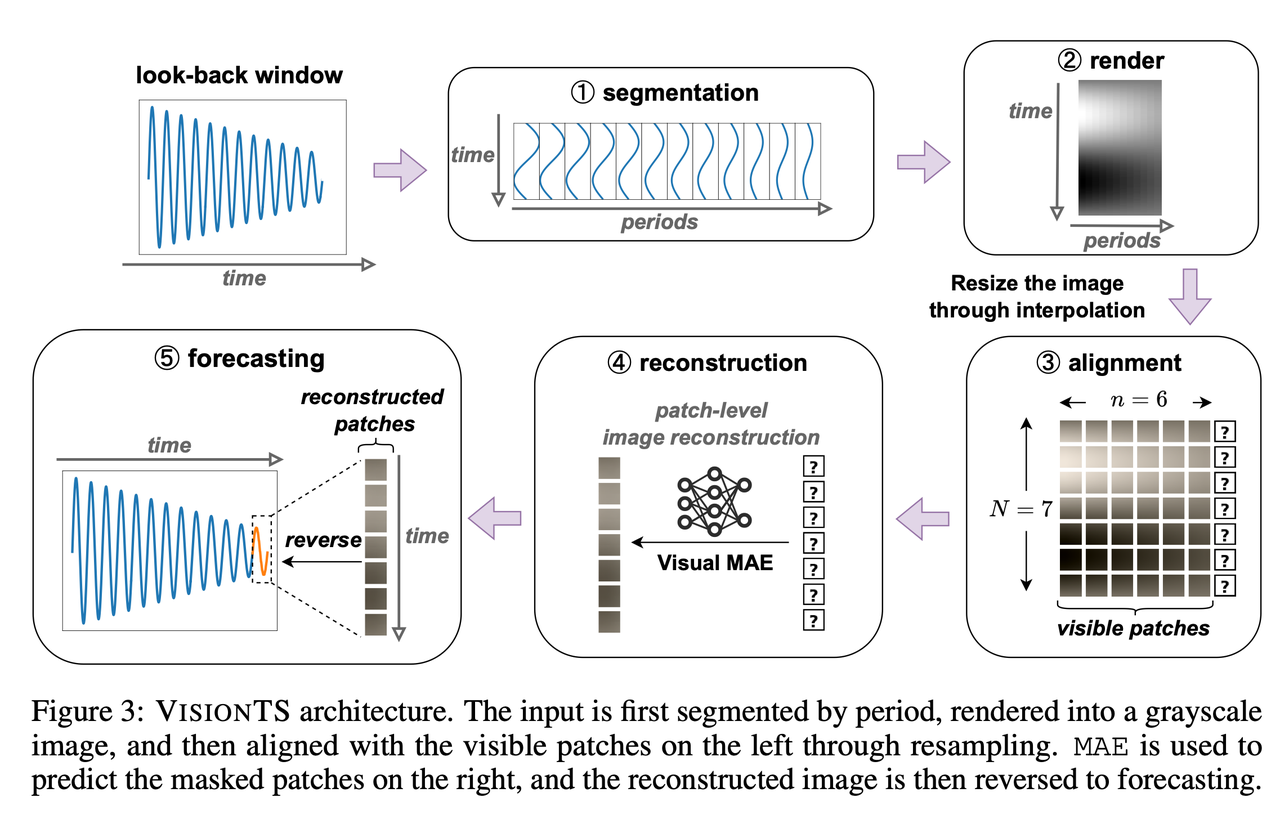
- This paper proposes an innovative method that transforms the time series forecasting task into a visual reconstruction task, using image pre-trained models for time series forecasting. The authors convert time series into two-dimensional visual matrices and mask parts of the images to simulate future value predictions. This allows the model to directly gain forecasting capabilities from natural image pre-training without specialized time series training. This method performs excellently in zero-shot scenarios and achieves state-of-the-art performance in most cases with minimal fine-tuning, demonstrating the strong cross-modal transfer potential of image models.
- Note: As early as ICLR 2023, the TimesNet paper had already proposed that 2D representation of time series is an effective visual representation method. However, this paper goes a step further by utilizing a pre-trained MAE ViT for zero-shot evaluation, finding excellent results.
Future Research Directions
In summary, transforming time series data into visual modalities not only fully leverages the visual processing advantages of large models but also significantly enhances the performance of time series tasks in zero-shot and few-shot environments. This trend indicates that one of the key future research directions in time series analysis is to optimize visual representations to better meet the processing needs of large models and to design visual expression methods that align with the characteristics of time series.
The development in this field will revolve around two main directions.
Firstly, an important direction is to develop specialized models that focus on the visual representation methods of time series. This direction emphasizes deeply exploring the features of time series and effectively transforming them into visual representations to retain and enhance the expressiveness of time series information. Through specific visual transformation methods, more representative and higher resolution time series images can be generated, optimizing the data structure and spatial relationships between features, enabling models to more accurately capture the complex characteristics of time series.
The second development direction is to utilize existing multimodal large models (such as GPT-4, Gemini-1.5-pro, etc.) to analyze time series data. These large models possess excellent cross-modal reasoning and few-shot learning capabilities. By introducing visual modalities, time series data can directly benefit from the visual reasoning advantages of large models. Future research will further explore how to achieve better performance of these large models on time series tasks, such as introducing multimodal reference learning modules or multi-scaled self-reflection mechanisms, enabling large models to quickly adapt to and master the normal patterns of time series, thereby improving performance in anomaly detection and trend forecasting.
By combining specialized models with multimodal large models, visual modalities will play an increasingly important role in time series analysis. Exploring how to effectively construct visual features compatible with large models and optimize the transmission of visual information within large models will provide new possibilities for innovation in time series analysis, accelerating the deep integration of time series with multimodal large models in a wide range of applications.

